Contents
Figure 1: Under every ML algorithm is a handful of simple ideas, repeated with different math
Supervised, unsupervised, and reinforcement learning — plus the 2026 tabular model shift
Machine learning sounds like magic until you see what's underneath: a handful of surprisingly simple ideas, repeated with different math. Once you know what each algorithm is actually trying to do, picking one stops being guesswork. This guide explains the main families of algorithms in plain language, shows when to use each, runs a quick experiment you can try yourself, and covers a 2026 shift worth knowing about in how tabular data gets modeled.
What Machine Learning Actually Is
In traditional programming, you write the rules and the computer applies them. In machine learning, you give the computer examples and it works out the rules itself. Show it thousands of emails labeled spam or not spam, and it learns what spam looks like without anyone writing "if the subject contains 'free money'."
Every ML algorithm boils down to the same loop: make predictions, measure how wrong they are with a loss function, and adjust internal settings to be less wrong. The algorithms differ in what those internal settings look like. A linear model adjusts weights, a decision tree adjusts split points, and a neural network adjusts millions of connection strengths.
The Three Main Families
Supervised learning learns from labeled examples. If the label is a category (spam or not, cat or dog), it's classification. If it's a number (a house price, tomorrow's sales), it's regression. This covers most business applications.
Unsupervised learning finds structure in data with no labels. It groups similar customers (clustering), compresses many features into a few (dimensionality reduction), or flags weird records (anomaly detection).
Reinforcement learning learns by trial and error. An agent takes actions, receives rewards, and learns a strategy to maximize them, which is how game-playing systems and many robotics controllers learn. (The curriculum learning guide and the DQN vs PPO comparison earlier in this series dig into this.)
Large language models are mostly trained with self-supervised learning, where the data supplies its own labels, such as predicting the next word. That's a different recipe, but the same learn-from-examples principle.
How Learning Goes Right and Wrong
Three ideas explain most of ML practice:
- Train, validation, and test splits. You train on one slice, tune choices on a second, and judge the final result on a third that the model has never seen. Grading a model on the data it studied is like giving students the exam questions in advance.
- Overfitting happens when a model memorizes quirks of the training data and fails on new data. Underfitting is the opposite: the model is too simple to capture the real pattern.
- Bias and variance. Simple models tend toward high bias (consistently wrong in the same way), and complex ones toward high variance (too sensitive to the training sample). Good modeling finds the sweet spot.
Supervised Algorithms, One at a Time
Linear regression fits a straight line (or plane) through the data to predict a number. Strengths: fast, interpretable, a great baseline. Weaknesses: can't capture curves or interactions unless you engineer them. Use it for: quick baselines and relationships you need to explain.
Logistic regression — despite the name, it's a classifier. It estimates the probability of a class from a weighted sum of features. Strengths: fast, interpretable coefficients, well-calibrated probabilities with regularization. Weaknesses: linear decision boundaries. Use it for: a first classification baseline, almost always.
k-Nearest Neighbors (k-NN) predicts by looking at the k most similar training examples and voting. Strengths: no training step, easy to understand. Weaknesses: slow on big data, sensitive to feature scaling and irrelevant features. Use it for: small datasets and similarity-based problems.
Naive Bayes applies Bayes' rule while assuming features are independent. That assumption is rarely true and often works well anyway. Strengths: extremely fast, good with little data and text. Weaknesses: probabilities can be poorly calibrated. Use it for: quick text classification baselines.
Decision trees ask a series of yes/no questions about features to reach a prediction, like a flowchart learned from data. Strengths: intuitive, handle mixed data types, no scaling needed. Weaknesses: a single deep tree overfits badly. Use it for: explaining logic and as the building block for ensembles.
Random forests train many trees on random subsets of data and features, then average their votes (a technique called bagging). Strengths: strong out of the box, robust, little tuning. Weaknesses: larger and slower than single models, less interpretable. Use it for: a dependable general-purpose tabular model.
Gradient boosting (XGBoost, LightGBM, CatBoost) builds trees one after another, each fixing the previous ones' mistakes. Strengths: often the top performer on structured tabular data. Weaknesses: needs tuning, can overfit, and sequential training is less forgiving than random forests. Use it for: most serious tabular problems. scikit-learn includes HistGradientBoosting, a fast implementation inspired by LightGBM.
Support vector machines (SVM) find the boundary that separates classes with the widest possible margin, and use "kernels" to handle curved boundaries. Strengths: effective on small to medium, high-dimensional data. Weaknesses: slow on large datasets, needs scaling and careful tuning. Use it for: smaller datasets where you want a strong non-linear model.
Neural networks are layers of simple units that learn increasingly abstract features. Convolutional networks excel at images, recurrent networks and transformers at sequences and language. Strengths: unmatched on images, audio, and text, and scale with data. Weaknesses: data-hungry, compute-hungry, hard to interpret, and usually not the best choice for small tabular data. Use them for: unstructured data, ideally starting from pretrained models.
Unsupervised Algorithms
- k-means groups points into k clusters around centers. It's fast and simple, but you must choose k and it assumes roundish clusters.
- Hierarchical clustering builds a tree of nested groups, useful when you want to see structure at several levels.
- DBSCAN finds dense regions and labels sparse points as noise, so it handles odd cluster shapes and outliers.
- PCA compresses features into a few directions that capture most variation, for visualization, noise reduction, and speed.
- t-SNE and UMAP produce 2D maps of high-dimensional data for exploration. Treat them as pictures to inspect, not as proof of structure.
- Isolation Forest flags anomalies by how easily points can be isolated, a staple for fraud and fault detection.
Reinforcement Learning in One Paragraph
An agent observes a state, picks an action, receives a reward, and updates its strategy to earn more reward over time. Value-based methods like Q-learning estimate how good each action is, while policy-gradient methods such as PPO directly improve the strategy. Reinforcement learning is powerful and finicky: it needs a well-designed reward and plenty of experience, and beginners should master supervised learning first.
A 2026 Update: Tabular Foundation Models
For years the standard advice for tabular data was simple: use gradient boosting. That's still a strong default, with one 2026 analysis concluding that gradient-boosted trees still beat deep learning on tabular data in the majority of cases, though the exceptions are real and increasingly common.
The big change is a new category: tabular foundation models like TabPFN and TabICL. These are neural networks pretrained on huge numbers of synthetic tables, so they can predict on your dataset in a single pass with no training or tuning. TabPFN's second version was published in Nature in January 2025 and beat tuned tree-based models on datasets of up to 10,000 rows, and later versions have raised the size limits, with larger variants reportedly handling up to a million rows by mid-2026. On the TabArena leaderboard, the top single models are now tabular foundation models, though leaders caution that this is a small-and-medium-data result, because context-length limits still bound how much data fits in one pass. Other benchmarks find that on large numeric datasets, models such as XGBoost still outperform foundation approaches.
So where's the crossover? Sources disagree, which is a good sign to test on your own data. A sensible beginner's takeaway: start with simple baselines, try gradient boosting as your workhorse, and if your dataset is small, try a tabular foundation model too. Check the license terms and hardware needs, since some of these models want a GPU.
Choosing an Algorithm
- Tabular data, any size: a regularized linear model as a baseline, then gradient boosting. For small tables, add a tabular foundation model to the comparison.
- Need to explain the model: linear and logistic regression, shallow trees, or an Explainable Boosting Machine (covered in the InterpretML guide).
- Images: convolutional networks or vision transformers, usually fine-tuned from pretrained weights.
- Text: pretrained transformers, or LLMs for generative tasks, with simple baselines like logistic regression on TF-IDF features first.
- Time series: simple baselines (naive forecasts, exponential smoothing, ARIMA), then gradient boosting with lag features, then deep models if the data justifies them — the Prophet tutorial covers one strong mid-tier option.
- No labels: clustering, PCA, and anomaly detection, remembering that evaluation is subjective without ground truth.
- Tiny datasets: simple regularized models, and be wary of anything complex.
Try It Yourself
This script compares several classic algorithms on a dataset bundled with scikit-learn, using cross-validation:
from sklearn.datasets import load_breast_cancer
from sklearn.ensemble import HistGradientBoostingClassifier, RandomForestClassifier
from sklearn.linear_model import LogisticRegression
from sklearn.model_selection import StratifiedKFold, cross_val_score
from sklearn.neighbors import KNeighborsClassifier
from sklearn.pipeline import make_pipeline
from sklearn.preprocessing import StandardScaler
from sklearn.svm import SVC
from sklearn.tree import DecisionTreeClassifier

X, y = load_breast_cancer(return_X_y=True)
cv = StratifiedKFold(n_splits=5, shuffle=True, random_state=0)

models = {
    "Logistic regression": make_pipeline(StandardScaler(), LogisticRegression(max_iter=1000)),
    "k-nearest neighbors": make_pipeline(StandardScaler(), KNeighborsClassifier()),
    "SVM (RBF kernel)": make_pipeline(StandardScaler(), SVC()),
    "Decision tree": DecisionTreeClassifier(max_depth=4, random_state=0),
    "Random forest": RandomForestClassifier(n_estimators=300, random_state=0),
    "Gradient boosting": HistGradientBoostingClassifier(random_state=0),
}

for name, model in models.items():
    scores = cross_val_score(model, X, y, cv=cv, scoring="roc_auc")
    print(f"{name:<22} AUC {scores.mean():.3f} ± {scores.std():.3f}")
A few things to notice. Distance-based models (k-NN, SVM) and logistic regression sit inside pipelines with a scaler, because they're sensitive to feature scale, while trees don't need scaling. Putting the scaler in the pipeline also means it's fit only on each training fold, which prevents leakage. And the output includes a spread (±), since one number from one split can mislead. On an easy dataset like this one, you'll likely find the algorithms landing close together, which is itself a lesson: the simplest model that performs well is usually the right choice.
Evaluating Models Without Fooling Yourself
- Pick metrics that match the problem. Accuracy is fine for balanced classes and misleading otherwise, since a model that always predicts the majority class can score 99% on rare-event data. Use precision, recall, F1, ROC-AUC, or PR-AUC for classification, and MAE, RMSE, or R² for regression, as covered in the rare event detection guide.
- Always compare to a baseline, such as predicting the average or the most common class. A fancy model that barely beats a trivial one isn't worth shipping.
- Use cross-validation for small datasets, and keep a final test set untouched until the end.
- Watch for data leakage. Information from the future or the test set sneaking into training makes results look great and fail in production. Fit scalers, imputers, and encoders only on training data, ideally inside a pipeline.
Common Pitfalls
- Tuning hyperparameters on the test set, which quietly overfits to it.
- Preprocessing the whole dataset before splitting.
- Ignoring class imbalance.
- Forgetting to scale features for distance-based models.
- Reaching for deep learning on small tabular data.
- Treating correlation as causation.
- Skipping the baseline and the simple model.
- Judging a model by one lucky run.
- Chasing the newest algorithm instead of improving the data, which usually helps more.
Recommended Books
| Cover | Book | Description | Get it |
|---|---|---|---|
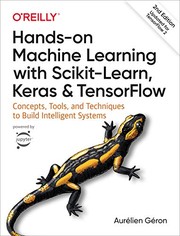 |
Hands-On Machine Learning with Scikit-Learn, Keras, and TensorFlow | - the standard practical tour of every algorithm family in this guide. | View on Amazon |
 |
An Introduction to Statistical Learning | - the theory behind bias, variance, and why the simple models hold up. | View on Amazon |
 |
The Hundred-Page Machine Learning Book | - exactly the plain-language compact reference this article is aiming at. | View on Amazon |
Unlock AI That Actually Works
Get lifetime access to GPT-6 Astra, Claude Fable 5.1, Gemini 3.5, Grok 4.5, and more — all in one platform. Build websites, apps, videos, content, and digital products from a single command. No monthly fees. No tool-hopping.
Click here to get GPTAstra Max now — one-time payment, lifetime access.
Frequently Asked Questions
What's the difference between supervised and unsupervised learning?
Supervised learning learns from labeled examples — each input comes with the right answer, so the model can measure how wrong it is and adjust. If the label is a category it's classification (spam or not); if it's a number it's regression (a house price). Unsupervised learning has no labels at all: it finds structure instead, grouping similar records (clustering), compressing features (dimensionality reduction), or flagging outliers (anomaly detection). Most business applications are supervised.
Which machine learning algorithm should a beginner start with?
Start with a regularized linear model (logistic regression for classification, linear regression for regression) as your baseline, then try gradient boosting — decision trees bundled into ensembles like XGBoost, LightGBM, or scikit-learn's HistGradientBoostingClassifier. That pair covers most tabular problems. Use proper cross-validation to compare, and pick the simplest model that performs well enough: on easy datasets the advanced algorithms often barely beat the basics.
What are tabular foundation models, and do they replace gradient boosting?
Models like TabPFN and TabICL are neural networks pretrained on huge numbers of synthetic tables, so they can predict on your dataset in a single pass with no training or tuning. TabPFN's second version was published in Nature in January 2025 and beat tuned tree-based models on datasets up to 10,000 rows, and later versions have pushed the limit higher. But gradient-boosted trees still win on many large tabular datasets, and context-length limits bound how much data fits in one pass. Treat them as a strong extra candidate for small-to-medium tables, not a replacement — test on your own data.
How do I evaluate a machine learning model honestly?
Split data into train, validation, and test sets, and never touch the test set until the end. Match metrics to the problem: accuracy misleads on imbalanced classes, so use precision, recall, F1, ROC-AUC, or PR-AUC for classification and MAE, RMSE, or R² for regression. Always compare against a trivial baseline, use cross-validation on small datasets, and watch for data leakage — scalers, imputers, and encoders must be fit only on training folds, ideally inside a pipeline.
Wrapping This Up
Machine learning algorithms are different strategies for the same task: learn patterns from examples without being told the rules. Linear and logistic regression give you explainable baselines, trees and ensembles handle most tabular problems, SVMs and k-NN fit smaller datasets, neural networks dominate images, audio, and text, and unsupervised methods find structure when there are no labels. In 2026, tabular foundation models have joined gradient boosting as a serious option for smaller datasets.
Begin with a simple baseline, add gradient boosting, compare using proper cross-validation, and pick the simplest model that meets your needs. The skill that matters isn't memorizing algorithms, it's testing them honestly on your data.