 Buy me a coffee
Contents
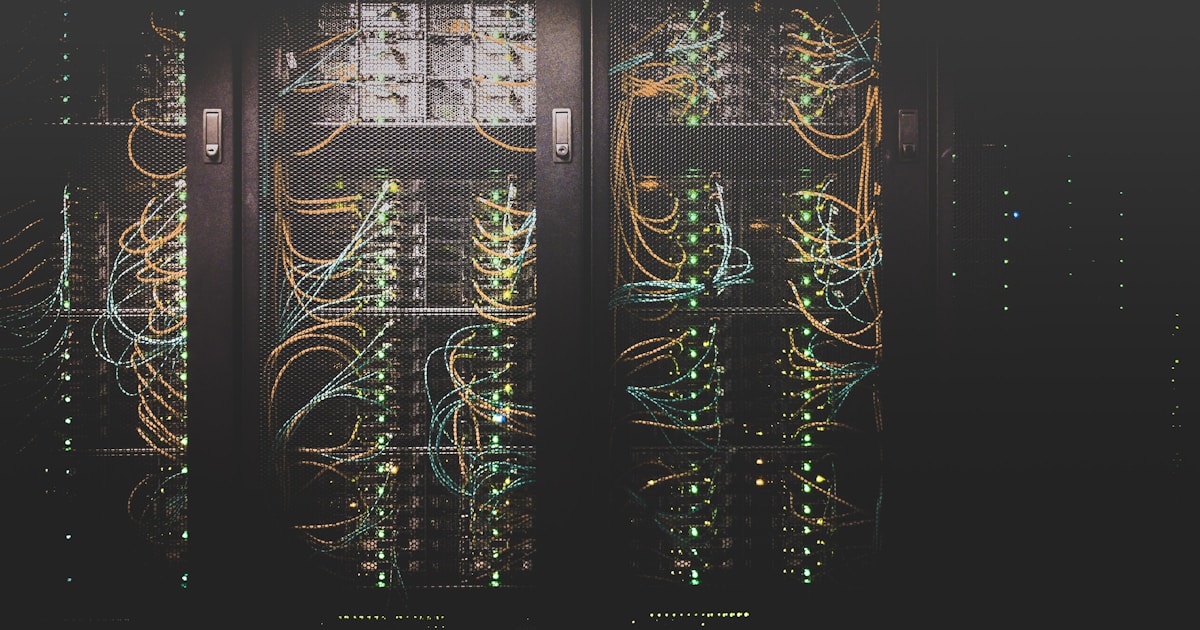
Figure 1: The demo is the afternoon; production is the discipline
Ten components, a reference architecture, an instrumented call, and the late-2026 tooling map
Getting a language model to produce a good answer in a demo takes an afternoon. Keeping that answer good for thousands of users, across model updates, prompt changes, new data, and adversarial input, without bankrupting you, is a different job.
That job is LLMOps: the practices, workflows, and tooling for building, deploying, monitoring, and continuously improving applications built on large language models. This guide explains what's different from classic MLOps, walks through each part of the lifecycle, shows a minimal instrumented LLM call, and covers the tooling landscape as it stands in late 2026.
LLMOps vs MLOps
LLMOps inherits MLOps' goals of reliability, reproducibility, and monitoring, but several things change:
- Outputs are open-ended and non-deterministic. There's often no single right answer, so quality is judged by rubrics, judges, and humans instead of accuracy against a label.
- Prompts are the new code. Behavior lives in prompt text, retrieval setup, and tool definitions, and small edits can change outcomes dramatically.
- The model is often someone else's. Calling a provider's API means providers can update, deprecate, or reprice a model underneath you. You monitor and pin a dependency you don't control.
- Cost scales with tokens, so every design choice, from context length to retries, has a price.
- Failure looks different. Instead of a model that's slightly less accurate, you get hallucinations, prompt injection, unsafe outputs, and agents that loop or take wrong actions.
- Retrieval and tools are part of the system. RAG pipelines, vector indexes, and tool integrations need their own operations.
- Feedback is rich but noisy: free-text user reactions, thumbs, edits, and escalations.
Classic MLOps still applies where you train or fine-tune models, but for most teams LLMOps is about operating the system around a model.
The Components of LLMOps
1. Prompt and Configuration Management
Treat prompts, system messages, tool schemas, model names, and sampling parameters as versioned artifacts. Store them in git or a prompt registry, give every version an ID, and record that ID in every trace. Separate prompts from application code where you can, so a prompt change can be reviewed, evaluated, and rolled back without a full deploy. Use environments (dev, staging, production) with promotion gates.
2. Data and Retrieval Operations
If you use RAG, the retrieval pipeline is a production system:
- Ingestion: connectors, parsing, chunking strategy, deduplication, and metadata.
- Embeddings: version the embedding model, since changing it requires re-indexing.
- Index freshness: how quickly new or changed documents appear, and how deletions propagate.
- Access control: retrieval must respect user permissions, or you've built a data-leak machine.
- Retrieval quality: measure whether the right chunks come back, separately from whether the answer is good.
3. Model Selection, Routing, and Gateways
Choose models by evaluating on your own tasks, not by public leaderboards alone. Pin exact model versions where the provider allows it, and test before upgrading. An LLM gateway centralizes provider keys, failover between providers, rate limiting, caching, per-team budgets, and logging. Routing simple requests to cheaper models and hard ones to stronger models is one of the biggest cost levers. Fine-tuning is worth considering when prompting and retrieval can't reach your quality or cost target — and it brings classic MLOps work with it: datasets, training runs, evaluation, and versioned artifacts.
4. Evaluation
Evaluation is the center of LLMOps, and it's still underused. One 2026 roundup citing a survey reports that 89% of surveyed organizations use agent observability, while 52.4% run offline evals and 37.3% run online evals — many teams watch their systems more than they test them. A solid evaluation practice includes:
- Offline datasets: curated, versioned cases with expected behavior, built from real failures, covering edge cases and adversarial inputs.
- Graders: code-based checks first, then LLM judges validated against human labels — the same layering the agent evaluation guide walks through.
- RAG-specific metrics: context precision and recall, faithfulness to retrieved sources, and answer relevance.
- CI gates: evaluations run automatically on every prompt, model, or pipeline change, blocking regressions.
- Online evaluation: sampling live traffic for scoring, and collecting user feedback.
5. Deployment
Deployment patterns for LLM apps follow the hosting and deployment guide in this series: durable state for long tasks, asynchronous execution, streaming, idempotent tools, and safe rollouts. Because prompts and model choices are configuration, you can use feature flags, canary releases, and instant rollbacks to limit the blast radius of a bad change. Always keep a known-good configuration ready to restore.
6. Observability
Traditional monitoring tells you a request was slow. LLM observability tells you why an answer was wrong. The core object is the trace: a record of one request including each model call, retrieval step, and tool call, with inputs, outputs, latency, tokens, and cost. Good traces let you answer "which prompt version, which retrieved documents, and which tool results led to this output?" — exactly the question the observability guide dissects tool by tool.
Track at minimum:
- Latency: time to first token and total time.
- Tokens and cost: per request, user, feature, and model.
- Errors: timeouts, rate limits, malformed outputs, and tool failures.
- Quality signals: automated scores, judge results, and user feedback.
- Retrieval health: hit rates and empty or low-relevance retrievals.
- Safety signals: guardrail triggers, refusals, and flagged outputs.
- Drift: shifts in input topics or length, and in output quality over time.
7. Guardrails and Security
Layer defenses: input validation and injection screening, output filters for policy and PII, least-privilege tool access, human approval for irreversible actions, and regular red-teaming — each covered in depth by the agent guardrails guide. Treat retrieved content and tool outputs as untrusted data, and log security-relevant events.
8. Cost and Performance Management
Control spend with token budgets per request, prompt caching and, carefully, semantic caching, model routing, context trimming, batching for offline work, and spend alerts per team or feature. Track cost per successful task, not just per call, since retries and agent loops hide the real price.
9. Feedback Loops and Continuous Improvement
Production is your best source of test cases. Collect explicit feedback (ratings, edits) and implicit signals (retries, escalations, abandonment), triage failures, label them, and add them to your evaluation set. Then improve with the lowest-cost lever first: better prompts, better retrieval, then fine-tuning. Some platforms now offer automated prompt optimization driven by evaluation results — MLflow, for example, ships optimizers based on the GEPA and MIPRO algorithms — though you should validate any automated change against your own held-out evaluations.
10. Governance and Compliance
Keep audit trails of prompt, model, and configuration changes, retention and access policies for logged conversations, and documentation that supports your regulatory obligations (the EU AI Act being the obvious one). Be deliberate about what you log, because traces can contain personal and sensitive data.
A Reference Architecture
In words: a client calls your API, which passes through a gateway that handles authentication, rate limits, and budgets. An orchestration layer loads the active prompt version from a registry, retrieves context from a vector store with access checks, calls one or more models through the gateway, and invokes tools under permission controls. Every step emits OpenTelemetry traces to an observability backend. An evaluation pipeline runs in CI against versioned datasets and samples production traces for online scoring. A feedback store collects user signals, and a deployment system promotes prompt and model changes through environments with canary rollouts and feature flags.
A Minimal Instrumented LLM Call
This wrapper adds the essentials to every model call: a trace span, GenAI-style attributes, a prompt version tag, retries with backoff, and cost and latency recording. It uses OpenTelemetry, which keeps your instrumentation portable across backends. Prices here are placeholders, so load real ones from configuration:
import time
from opentelemetry import trace
from opentelemetry.exporter.otlp.proto.http.trace_exporter import OTLPSpanExporter
from opentelemetry.sdk.trace import TracerProvider
from opentelemetry.sdk.trace.export import BatchSpanProcessor

provider = TracerProvider()
provider.add_span_processor(BatchSpanProcessor(OTLPSpanExporter()))  # endpoint via OTEL_EXPORTER_OTLP_ENDPOINT
trace.set_tracer_provider(provider)
tracer = trace.get_tracer("support-bot")

PROMPT_VERSION = "support-answer@2026-10-12"
PRICE_PER_MTOK = {"in": 3.0, "out": 15.0}      # placeholder numbers: load from config

def traced_llm_call(client, model, system, messages, max_retries=2):
    with tracer.start_as_current_span(f"chat {model}") as span:
        span.set_attribute("gen_ai.operation.name", "chat")
        span.set_attribute("gen_ai.request.model", model)
        span.set_attribute("app.prompt_version", PROMPT_VERSION)
        start = time.time()

        for attempt in range(max_retries + 1):
            try:
                resp = client.messages.create(model=model, max_tokens=800,
                                              system=system, messages=messages)
                break
            except Exception as e:            # narrow to transient provider errors in real code
                span.add_event("retry", {"attempt": attempt, "error": type(e).__name__})
                if attempt == max_retries:
                    span.record_exception(e)
                    raise
                time.sleep(2 ** attempt)

        usage = resp.usage
        cost = (usage.input_tokens * PRICE_PER_MTOK["in"]
                + usage.output_tokens * PRICE_PER_MTOK["out"]) / 1e6
        span.set_attribute("gen_ai.usage.input_tokens", usage.input_tokens)
        span.set_attribute("gen_ai.usage.output_tokens", usage.output_tokens)
        span.set_attribute("app.cost_usd", round(cost, 6))
        span.set_attribute("app.latency_s", round(time.time() - start, 3))
        return resp
Three notes on this sketch. It deliberately doesn't record prompt or response text, since that can leak personal data into your telemetry — if you capture content for debugging, redact it first and sample. The gen_ai.* attribute names follow OpenTelemetry's GenAI semantic conventions, which, according to one 2026 comparison, are still marked Development — expect attribute names to change before they stabilize, so check the current specification when you wire this up. And the retry catch-all should be narrowed to transient errors, because retrying a bad request just wastes money.
The Tooling Landscape (Late 2026)
The market has several overlapping categories. A 2026 comparison groups them this way: platforms such as Langfuse, LangSmith, Braintrust, and Arize treat the LLM trace as the primary object; evaluation tools such as Phoenix, DeepEval, MLflow, and RAGAS emphasize scoring; and gateways such as Helicone and Portkey add routing, caching, and cost controls.
- Langfuse: open-source core (MIT), self-hostable, OpenTelemetry-friendly, with tracing, evals, and prompt management. It was acquired by ClickHouse in January 2026, per one roundup.
- LangSmith: LangChain's platform, strongest for LangChain and LangGraph teams, with tracing, datasets, and evaluation. It's proprietary.
- Braintrust: evaluation-first, with versioned datasets, scoring, prompt experiments, and CI regression testing. Self-hosting is available only on its enterprise plan.
- Arize Phoenix: a source-available, OpenTelemetry-native tracer and evaluator under the Elastic License 2.0. Dynatrace signed an agreement on August 13, 2026 to acquire Arize, so check how that affects Phoenix's roadmap and licensing.
- MLflow: an Apache-2.0 platform that has grown from experiment tracking into GenAI tracing, judges, and prompt optimization — attractive if you already use it for classic ML.
- Others: W&B Weave, Opik, DeepEval and Confident AI for pytest-style evals, Datadog's LLM observability for teams already on Datadog, Guardrails AI for output validation, and Promptfoo for evaluation and red-teaming (OpenAI announced its acquisition earlier this year).
Two cautions. Most comparisons come from vendors or sites with their own interests, so test candidates on your own traces. And this space is consolidating quickly through acquisitions, so protect yourself: instrument with OpenTelemetry, require OTLP ingestion in any platform you buy, keep your datasets and prompts exportable, and check licenses — source-available is not the same as open source. A common production setup combines two tools, such as an open-source tracer for self-hosted analytics plus a dedicated evaluation product.
A Maturity Roadmap
- Stage 1, Prototype: prompts in code, manual testing, no monitoring. Fine for a demo, risky for users.
- Stage 2, Basic operations: prompts in version control, tracing with cost and latency, a small smoke-test evaluation set, spend alerts, and a documented rollback.
- Stage 3, Disciplined delivery: versioned evaluation datasets with CI gates, a gateway with budgets and failover, canary releases, red-team tests, and a feedback pipeline that turns failures into test cases.
- Stage 4, Continuous improvement: online evaluation on sampled traffic, drift monitoring, automated regression detection after provider updates, governance and audit processes, and optimization loops.
Move up one stage at a time, driven by the failures you actually see.
Common Failure Modes
- Silent regressions after a prompt edit, a model upgrade, or a provider-side change. Pin versions, run evals in CI, and canary changes.
- Cost spikes from retries, long contexts, or looping agents. Set budgets and alerts.
- Stale or inaccessible knowledge from broken ingestion or missing access controls in RAG.
- Unmeasured quality, where monitoring covers uptime and latency but not answer correctness.
- Evaluation mismatch: offline datasets that don't resemble production traffic, or LLM judges nobody validated.
- Prompt injection and over-permissioned tools, especially in agents.
- Telemetry that leaks data, such as raw prompts and personal information in traces.
- No rollback path, so a bad change stays live while you debug.
Team and Process
Assign clear ownership for prompts, evaluation datasets, and production quality. Review prompt changes like code, with evaluation results attached. Write runbooks for incidents — provider outages, quality regressions, abuse — and rehearse them. Decide build versus buy deliberately: gateways, tracing, and evaluation tooling are mature enough to buy or adopt open source, while your datasets, rubrics, and domain-specific guardrails are the parts only you can build.
Common Pitfalls
- Treating the LLM app as a normal web service and monitoring only latency and errors.
- Letting prompts live as untracked strings scattered through the codebase.
- Shipping model or prompt changes without running evaluations.
- Relying on public benchmarks instead of your own task data.
- Logging everything without redaction or retention limits.
- Building on one provider with no failover or pinning.
- Picking an observability tool without OpenTelemetry export, then being stuck when the vendor changes ownership or pricing.
- Optimizing cost before measuring quality, or quality without watching cost.
Best Book to Read
| Cover | Book | Description | Get it |
|---|---|---|---|
 |
AI Engineering | building on top of foundation models as an engineering discipline: evaluation-first development, RAG systems, agents, and the operational concerns this guide summarizes. | View on Amazon |
 |
Designing Machine Learning Systems | the MLOps foundation LLMOps inherits: deployment patterns, monitoring, and train/serve consistency that still apply around a hosted model. | View on Amazon |
 |
Hands-On Large Language Models | the practical LLM layer: prompting, embeddings, retrieval, and evaluation with working code. | View on Amazon |
 |
Building LLM Powered Applications | from prototype to production for LLM apps: orchestration, vector databases, guardrails, and cost-aware design. | View on Amazon |
As an Amazon Associate I earn from qualifying purchases. Links on this page are affiliate links, and I may earn a commission at no extra cost to you.
Unlock AI That Actually Works
Get lifetime access to GPT-6 Astra, Claude Fable 5.1, Gemini 3.5, Grok 4.5, and more — all in one platform. Build websites, apps, videos, content, and digital products from a single command. No monthly fees. No tool-hopping.
Click here to get GPTAstra Max now — one-time payment, lifetime access.
Frequently Asked Questions
What is LLMOps and how is it different from MLOps?
LLMOps is the practices, workflows, and tooling for building, deploying, monitoring, and continuously improving applications built on large language models. It inherits MLOps' goals of reliability, reproducibility, and monitoring, but several things change: outputs are open-ended and non-deterministic (quality comes from rubrics, judges, and humans, not accuracy against a label), prompts are the new code (small edits can change outcomes dramatically), the model is often someone else's (providers can update, deprecate, or reprice underneath you), cost scales with tokens, failure looks different (hallucinations, prompt injection, looping agents), retrieval and tools are part of the system, and feedback is rich but noisy. Classic MLOps still applies where you train or fine-tune, but for most teams LLMOps is about operating the system around a model.
What should an LLM observability setup trace?
The core object is the trace: one request's full record — each model call, retrieval step, and tool call, with inputs, outputs, latency, tokens, and cost — so you can answer "which prompt version, which retrieved documents, and which tool results led to this output?" Track at minimum: time to first token and total latency, tokens and cost per request/user/feature/model, errors (timeouts, rate limits, malformed outputs, tool failures), quality signals (automated scores, judge results, user feedback), retrieval health (hit rates, empty retrievals), safety signals (guardrail triggers, refusals), and drift in inputs and output quality. Be deliberate about content: raw prompts and responses can leak personal data into telemetry — redact and sample if you capture them.
How do you evaluate an LLM application?
Build evaluation on five layers: offline datasets (curated, versioned cases built from real failures, including adversarial inputs), graders (code-based checks first, then LLM judges validated against human labels), RAG-specific metrics (context precision and recall, faithfulness to retrieved sources, answer relevance), CI gates that block regressions on every prompt, model, or pipeline change, and online evaluation that samples live traffic plus user feedback. One 2026 roundup citing a survey reports 89% of surveyed organizations use agent observability while only 52.4% run offline evals and 37.3% run online evals — many teams watch their systems more than they test them.
Where should a team start with LLMOps?
Four steps catch most of the problems that bite LLM apps in production: put prompts under version control, add tracing with token and cost recording, build a small evaluation set from your first real failures, and wire that evaluation into CI. Then climb the maturity roadmap one stage at a time, driven by the failures you actually see: prototype (prompts in code, manual testing) → basic operations (versioned prompts, tracing, smoke-test evals, spend alerts, documented rollback) → disciplined delivery (CI eval gates, gateway budgets and failover, canary releases, red-team tests, feedback pipeline) → continuous improvement (online evaluation, drift monitoring, governance, optimization loops).
Wrapping This Up
LLMOps is the discipline of running LLM applications as dependable products: versioned prompts and configurations, retrieval pipelines treated as production systems, continuous evaluation, trace-level observability, layered guardrails, cost controls, and a feedback loop that turns real failures into tests. The tooling is maturing and consolidating fast, with OpenTelemetry as the portability layer worth insisting on.
Where should you start? Put prompts under version control, add tracing with token and cost recording, build a small evaluation set from your first real failures, and wire it into CI. Those four steps catch most of the problems that bite LLM apps in production, and everything else in this guide builds on them.



 Join on Telegram