 Buy me a coffee

Contents
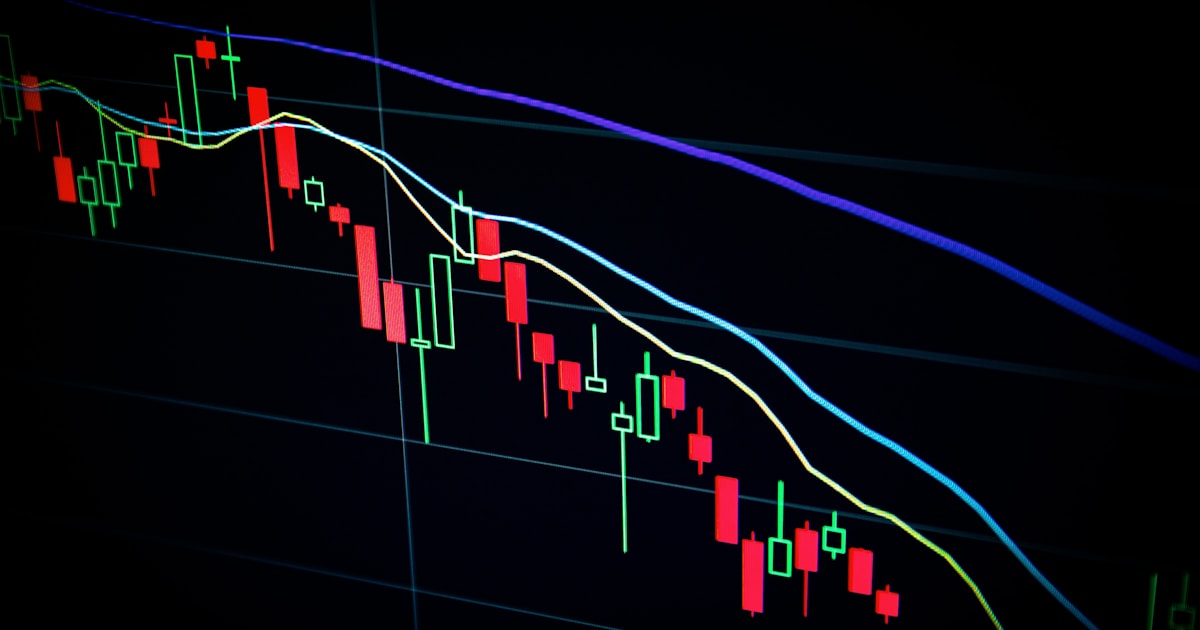
Figure 1: Best Anomaly Detection and Monitoring Platforms for Time Series Data — the spike is easy to see after the fact, and the platform's job is to see it at 2:07
Your dashboard looks fine at 2 p.m. By 2:07 a metric spikes, your phone buzzes, and nobody knows why. Time series anomaly detection exists to catch that spike before your customers do.
I have not run any of these platforms in production, and I will not pretend otherwise. What I did was read the vendor documentation in November 2026 and run one experiment on synthetic data: a static threshold against a learned seasonal baseline, on 1,344 hourly points. That experiment is the most useful thing in this article, so it comes first.
What Makes a Good Anomaly Detection Platform?
Every vendor claims "AI-powered insights". Most of them mean a threshold with better marketing. The checklist that actually matters is short:
- Learned baselines that account for daily and weekly seasonality.
- A low false-positive rate, because alert fatigue kills good monitoring.
- Fast ingestion for high-cardinality metrics.
- Root-cause context: what changed, not just that something changed.
- Alerting that plugs into Slack, PagerDuty, or whatever you already use.
Ever muted a noisy channel "just for today"? Then you know why the second item is the one that decides whether the platform survives contact with your team.
Static Thresholds vs Learned Baselines: A Measured Test
Static thresholds are simple. You say "alert me when CPU hits 90%", and the system does exactly that. They work for stable systems with predictable limits, and they fall apart on seasonal data.
I built eight weeks of hourly data with a daily cycle, a weekday bump and noise, then injected 12 anomalies of +40 into the last four weeks. The test region had 660 normal points, so a good detector should stay near zero false alarms while catching most of the 12.
| Method | False alarms (of 660 normal points) | Anomalies caught (of 12) |
|---|---|---|
| Static threshold from quiet hours (126) | 286 | 11 |
| Static threshold from training maximum (162) | 9 | 8 |
| Rolling z-score, 24h window, z > 3 | 0 | 4 |
| Seasonal profile (hour-of-week median, MAD scale), z > 4 | 9 | 12 |
| Seasonal profile, z > 6 | 0 | 12 |
The static threshold is the disaster the theory predicts. Set from quiet hours, 88% of weekday afternoon points sat above it, because the weekly swing ran from 126 to 186. Raise it to the training maximum and it goes quiet but misses a third of the real faults.
The rolling z-score fails in the other direction, and this is the part most teams do not expect. The anomaly sits inside the 24-hour window it is compared against, so it inflates its own mean and standard deviation. At z > 3 it caught 4 of 12; at z > 4 it caught none.
The seasonal baseline — the median for each hour of the week, scaled by median absolute deviation — caught all 12 with no false alarms at z > 6. That is the whole argument for buying a platform that learns your rhythm instead of one that lets you write expressions.
Two caveats, because this is one synthetic dataset. The scale was estimated on the training half, so it runs slightly tight, which is why I quote z > 4 as well as z > 6. And a seasonal profile needs history: four weeks was enough here, less would not be.
Datadog
Datadog's anomaly monitor is the most explicit about seasonality of any documentation I read. You pick an algorithm — basic, agile or robust — and for the latter two a seasonality of hourly, daily or weekly, plus a deviation band that widens or narrows the alert [1]. Those are the exact knobs the experiment above says matter.
The practical advantage is proximity: the monitor sits in the same product as logs, traces and infrastructure metrics, so a weird latency graph is one click from the trace behind it.
The usual objection is cost, and I did not model it. Ask what custom metrics and hosts do to your bill before you fall in love with the dashboards.
Grafana Cloud and Grafana Machine Learning
Grafana's machine learning line is now "forecast metrics, detect anomalies, and run automated investigations with Sift to alert on dynamic thresholds and surface likely causes" [2]. Dynamic thresholds are the point: the alert band moves with the metric instead of sitting at a number someone typed in 2021.
The draw is still flexibility. Grafana queries the sources you already run, so you do not migrate data to get detection. The trade-off is setup: you assemble the pieces, and you own the quality of the baseline.
If your team enjoys tinkering, this is the cheapest good answer. If nobody has time to tune it, an assembled pipeline is how you get a muted channel by Friday.
Dynatrace
Dynatrace's documentation describes a system that "establishes baselines, detects anomalies, and identifies root cause with topology and dependency context", and correlates "code changes, deployments, configuration, and policy updates to show what changed and why a problem occurred" [3].
That root-cause grouping is the feature that matters in microservice estates. Fifty alerts from one broken dependency is not fifty problems, and a platform that says so saves the on-call engineer an hour.
The cost is money and learning curve. For a five-service app it is more machine than the job needs.
Elastic Observability
Elastic's machine learning features "analyze time series data and identify anomalous patterns in your data set" [4]. If you already run the Elastic Stack, detection runs where your logs already are, with no export step.
That is a real advantage for teams whose incident investigations start in Kibana. The cost is cluster care: anomaly jobs need healthy shards and sensible retention, and a struggling cluster makes every alert suspect.
InfluxDB
This is where the roundup needs updating. InfluxDB 3 Core ships a Python processing engine, and its plugin library includes MAD anomaly detection, Prophet and Chronos forecasting, a River anomaly detector and a forecast-error evaluator [5]. Detection can run inside the database rather than beside it.
For sensor-heavy workloads that is a good fit: high-frequency writes, downsampling, and a plugin that scores each new window as it lands. It is not a turnkey incident platform — there is no root-cause graph of your microservices — and it is not trying to be.
Prometheus with Alertmanager
Prometheus is the open-source workhorse of cloud-native monitoring, and Alertmanager "takes care of deduplicating, grouping, and routing them to the correct receiver integration such as email, PagerDuty, or OpsGenie", plus silencing and inhibition [5].
What Alertmanager does not do is learn seasonality. Alerting rules are expressions you write, so the rolling z-score I measured above — 4 of 12 caught at z > 3, none at z > 4 — is exactly the ceiling of the hand-rolled approach unless you build a seasonal model yourself.
Plenty of teams pair it with Grafana or a dedicated ML layer for that reason. If you have an SRE who enjoys PromQL, this is the cheapest good stack in the list.
Open-Source Libraries for DIY Detection
If you want full control, the building blocks are all open source: Prophet for forecasting with seasonality, Isolation Forest in scikit-learn for outlier isolation, PyOD for a catalogue of detectors, and Kats or Merlion for broader toolkits.
I would use them for learning and for genuinely unusual data. For on-call duty at 3 a.m., a maintained platform beats a script only you understand.
How to Choose the Right Platform
Skip the feature matrix and answer three questions.
What Does Your Team Already Use?
The best platform plugs into the stack you have. If you run Elastic, test its anomaly jobs first. If you live in Grafana, add its ML features before shopping. Switching costs hurt more than any missing feature.
How Much Data Do You Generate?
High-cardinality data punishes sloppy pricing. Ask what custom metrics and hosts cost at your volume, and read the fine print. A cheap pilot turns into a painful invoice at scale.
Who Responds to Alerts?
A dedicated SRE team can tune PromQL rules all day. A three-person startup cannot. Match the maintenance burden to the capacity you have, not the capacity you wish you had.
Common Pitfalls
- Alerting on everything. More alerts mean more ignored alerts, not more safety.
- Skipping the baseline period. A learned model needs weeks; my test used four.
- Ignoring seasonality. A Monday traffic spike is not an incident, and a static threshold thinks it is — 286 false alarms' worth.
- Trusting a rolling z-score. The anomaly contaminates its own window: 4 of 12 caught at z > 3, 0 of 12 at z > 4.
- Never reviewing alerts. Hold a short monthly review, then delete or tune the noisy ones.
- Buying for the algorithm instead of the workflow. Root-cause context and routing matter more than the model's name.
Notice that none of those are "you picked the wrong vendor". Process beats tooling more often than people admit.
Best Book to Read
| Cover | Book | Description | Get it |
|---|---|---|---|
 |
Practical Monitoring | a short, opinionated book on alerting, dashboards and on-call that explains why a noisy channel is worse than no channel, which is the argument this whole article rests on. | View on Amazon |
As an Amazon Associate I earn from qualifying purchases. Links on this page are affiliate links, and I may earn a commission at no extra cost to you.
Wrapping Up
The best anomaly detection platform is the one your team will tune, trust and use. Fancy algorithms mean nothing if everyone mutes the alerts.
The measured version of that sentence: a static threshold set from quiet hours fired on 286 of 660 normal points, and a learned hour-of-week baseline at six sigma fired on none while catching all 12 injected faults. That gap is what you are buying.
Grab a trial this week and point it at your noisiest metric. If it catches something real, you have found a keeper. If it cries wolf all day, you found out before your pager did.
Frequently Asked Questions
What is the best anomaly detection platform for time series data?
The one your team will actually tune. On the vendor documentation, Datadog is the most explicit about seasonality (hourly, daily or weekly for its agile and robust algorithms), Dynatrace is the most explicit about root cause (baselines plus topology and dependency context), and Grafana Cloud is the most flexible about where the data lives. None of that replaces testing on your own metrics.
Do I need machine learning, or are static thresholds enough?
Both, for different jobs. In my test a static threshold set from quiet hours fired on 286 of 660 normal points because of the weekly cycle, while a learned hour-of-week baseline at six sigma fired on none and caught all 12 injected anomalies. Use static limits for hard caps like disk space and learned baselines for anything seasonal.
Why does a rolling z-score miss anomalies?
Because the anomaly sits inside the window it is compared against. With a 24-hour rolling mean and standard deviation at z>3, my test caught only 4 of 12 injected anomalies, and at z>4 it caught none. A seasonal profile built from clean history does not have that problem.
Is InfluxDB a full anomaly detection platform?
Closer than it used to be. InfluxDB 3 Core ships a Python processing engine with official plugins including MAD anomaly detection, Prophet and Chronos forecasting, and a River anomaly detector, so detection can run inside the database rather than beside it.
How long should a baseline learn before you trust the alerts?
At least two full cycles of whatever rhythm matters, which usually means two weeks for daily and weekly patterns. My test used four weeks of hourly history to build the profile, and the seasonality only became obvious once a full week was in the training half.
Sources
[1]Datadog, Anomaly monitors — thebasic,agileandrobustalgorithms, the hourly, daily and weekly seasonality settings for the agile and robust algorithms, and the deviation band: docs.datadoghq.com/monitors/types/anomaly[2]Grafana, Grafana Cloud Machine Learning — "Forecast metrics, detect anomalies, and run automated investigations with Sift to alert on dynamic thresholds and surface likely causes": grafana.com/docs/grafana-cloud/alerting-and-irm/machine-learning[3]Dynatrace, Dynatrace Intelligence — "establishes baselines, detects anomalies, and identifies root cause with topology and dependency context", and correlates code changes, deployments, configuration and policy updates: docs.dynatrace.com/docs/dynatrace-intelligence[4]Elastic, Anomaly detection with machine learning — "analyze time series data and identify anomalous patterns in your data set": elastic.co/guide/en/machine-learning/current/ml-ad-overview.html[5]Prometheus, Alertmanager — deduplicating, grouping and routing alerts to receivers such as email, PagerDuty or OpsGenie, plus silencing and inhibition: prometheus.io/docs/alerting/latest/alertmanager. InfluxDB, Processing engine and Python plugins — the official plugin library including MAD anomaly detection, Prophet and Chronos forecasting, the River anomaly detector and the forecast-error evaluator: docs.influxdata.com/influxdb3/core/plugins


 Get Free Course Notes →